
Crack tip strain field around a growing crack: 2D simulation Video
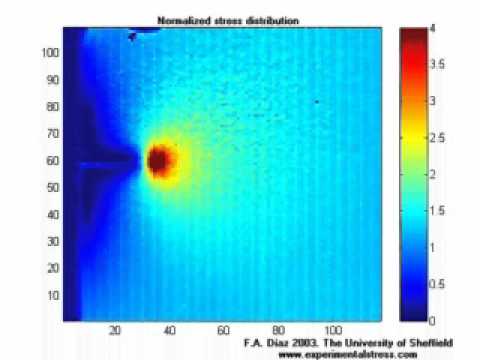
This resource is a video, illustrating how the stress field around a crack grows with the length of the crack, presented as a contour map. It was obtained by stitching together maps of the surface temperature (amplitude) captured with an infra-red camera during cyclic loading; and the temperature amplitude is directly proportional to the amplitude of the first stress invariant (sum of principal stresses), which drives the crack forward, based on the classical Paris law. So the crack growth will get faster and faster as the crack gets longer and eventually become unstable, leading to rupture. In-house software (FATCAT) was used to generate quantitative data rapidly from images generated by commercially available instrumentation. Courtesy of Francisco A. Diaz, University of Jaen, John R. Yates, The University of Manchester and Eann Patterson, The University of Liverpool. Released under Creative Commons Attribution Non-Commercial No Derivatives licence http://creativecommons.org/licenses/by-nc-nd/3.0/
About the Site 🌐
This site provides links to random videos hosted at YouTube, with the emphasis on random. 🎥
Origins of the Idea 🌱
The original idea for this site stemmed from the need to benchmark the popularity of a video against the general population of YouTube videos. 🧠
Challenges Faced 🤔
Obtaining a large sample of videos was crucial for accurate ranking, but YouTube lacks a direct method to gather random video IDs.
Even searching for random strings on YouTube doesn't yield truly random results, complicating the process further. 🔍
Creating Truly Random Links 🛠️
The YouTube API offers additional functions enabling the discovery of more random videos. Through inventive techniques and a touch of space-time manipulation, we've achieved a process yielding nearly 100% random links to YouTube videos.
About YouTube 📺
YouTube, an American video-sharing website based in San Bruno, California, offers a diverse range of user-generated and corporate media content. 🌟
Content and Users 🎵
Users can upload, view, rate, share, and comment on videos, with content spanning video clips, music videos, live streams, and more.
While most content is uploaded by individuals, media corporations like CBS and the BBC also contribute. Unregistered users can watch videos, while registered users enjoy additional privileges such as uploading unlimited videos and adding comments.
Monetization and Impact 🤑
YouTube and creators earn revenue through Google AdSense, with most videos free to view. Premium channels and subscription services like YouTube Music and YouTube Premium offer ad-free streaming.
As of February 2017, over 400 hours of content were uploaded to YouTube every minute, with the site ranking as the second-most popular globally. By May 2019, this figure exceeded 500 hours per minute. 📈
List of ours generators⚡
Random YouTube Videos Generator
Random Film and Animation Video Generator
Random Autos and Vehicles Video Generator
Random Pets and Animals Video Generator
Random Travel and Events Video Generator
Random People and Blogs Video Generator
Random Entertainment Video Generator
Random News and Politics Video Generator
Random Howto and Style Video Generator
Random Education Video Generator